Replay and analysis
Analyze speed
Compare speed, angle and consistency to understand your straight-line sailing.
iOS, Android and web · Core features; additional views and filters require Pro or Coach
Where to start
Activity → Advanced Analysis → Speed.
Choose the sailing to analyze
Select Full Activity or a saved segment, then choose Upwind or Downwind. The charts summarize qualifying straight-line sailing in that selection.
Choose a question and its measurements
Open Y Metrics. For an upwind speed comparison, start with SOG, VMG and CWA. These show how fast you sailed, how much progress you made toward the wind, and the angle you sailed at.
You can also select heel, pitch and the stability measures when the required data is available.
Look at the typical result and the spread
Start with All and the Box view. The line in the box is the median; the box shows the middle half of the results. Compare both tacks and look for differences in consistency as well as speed.
Explore the pattern
With Pro or Coach, Violin shows where results are concentrated. Scatter, available on larger screens, shows the relationship between two measurements chosen through X Axis and Y Metrics.
Return to replay to inspect the sailing behind a promising result.
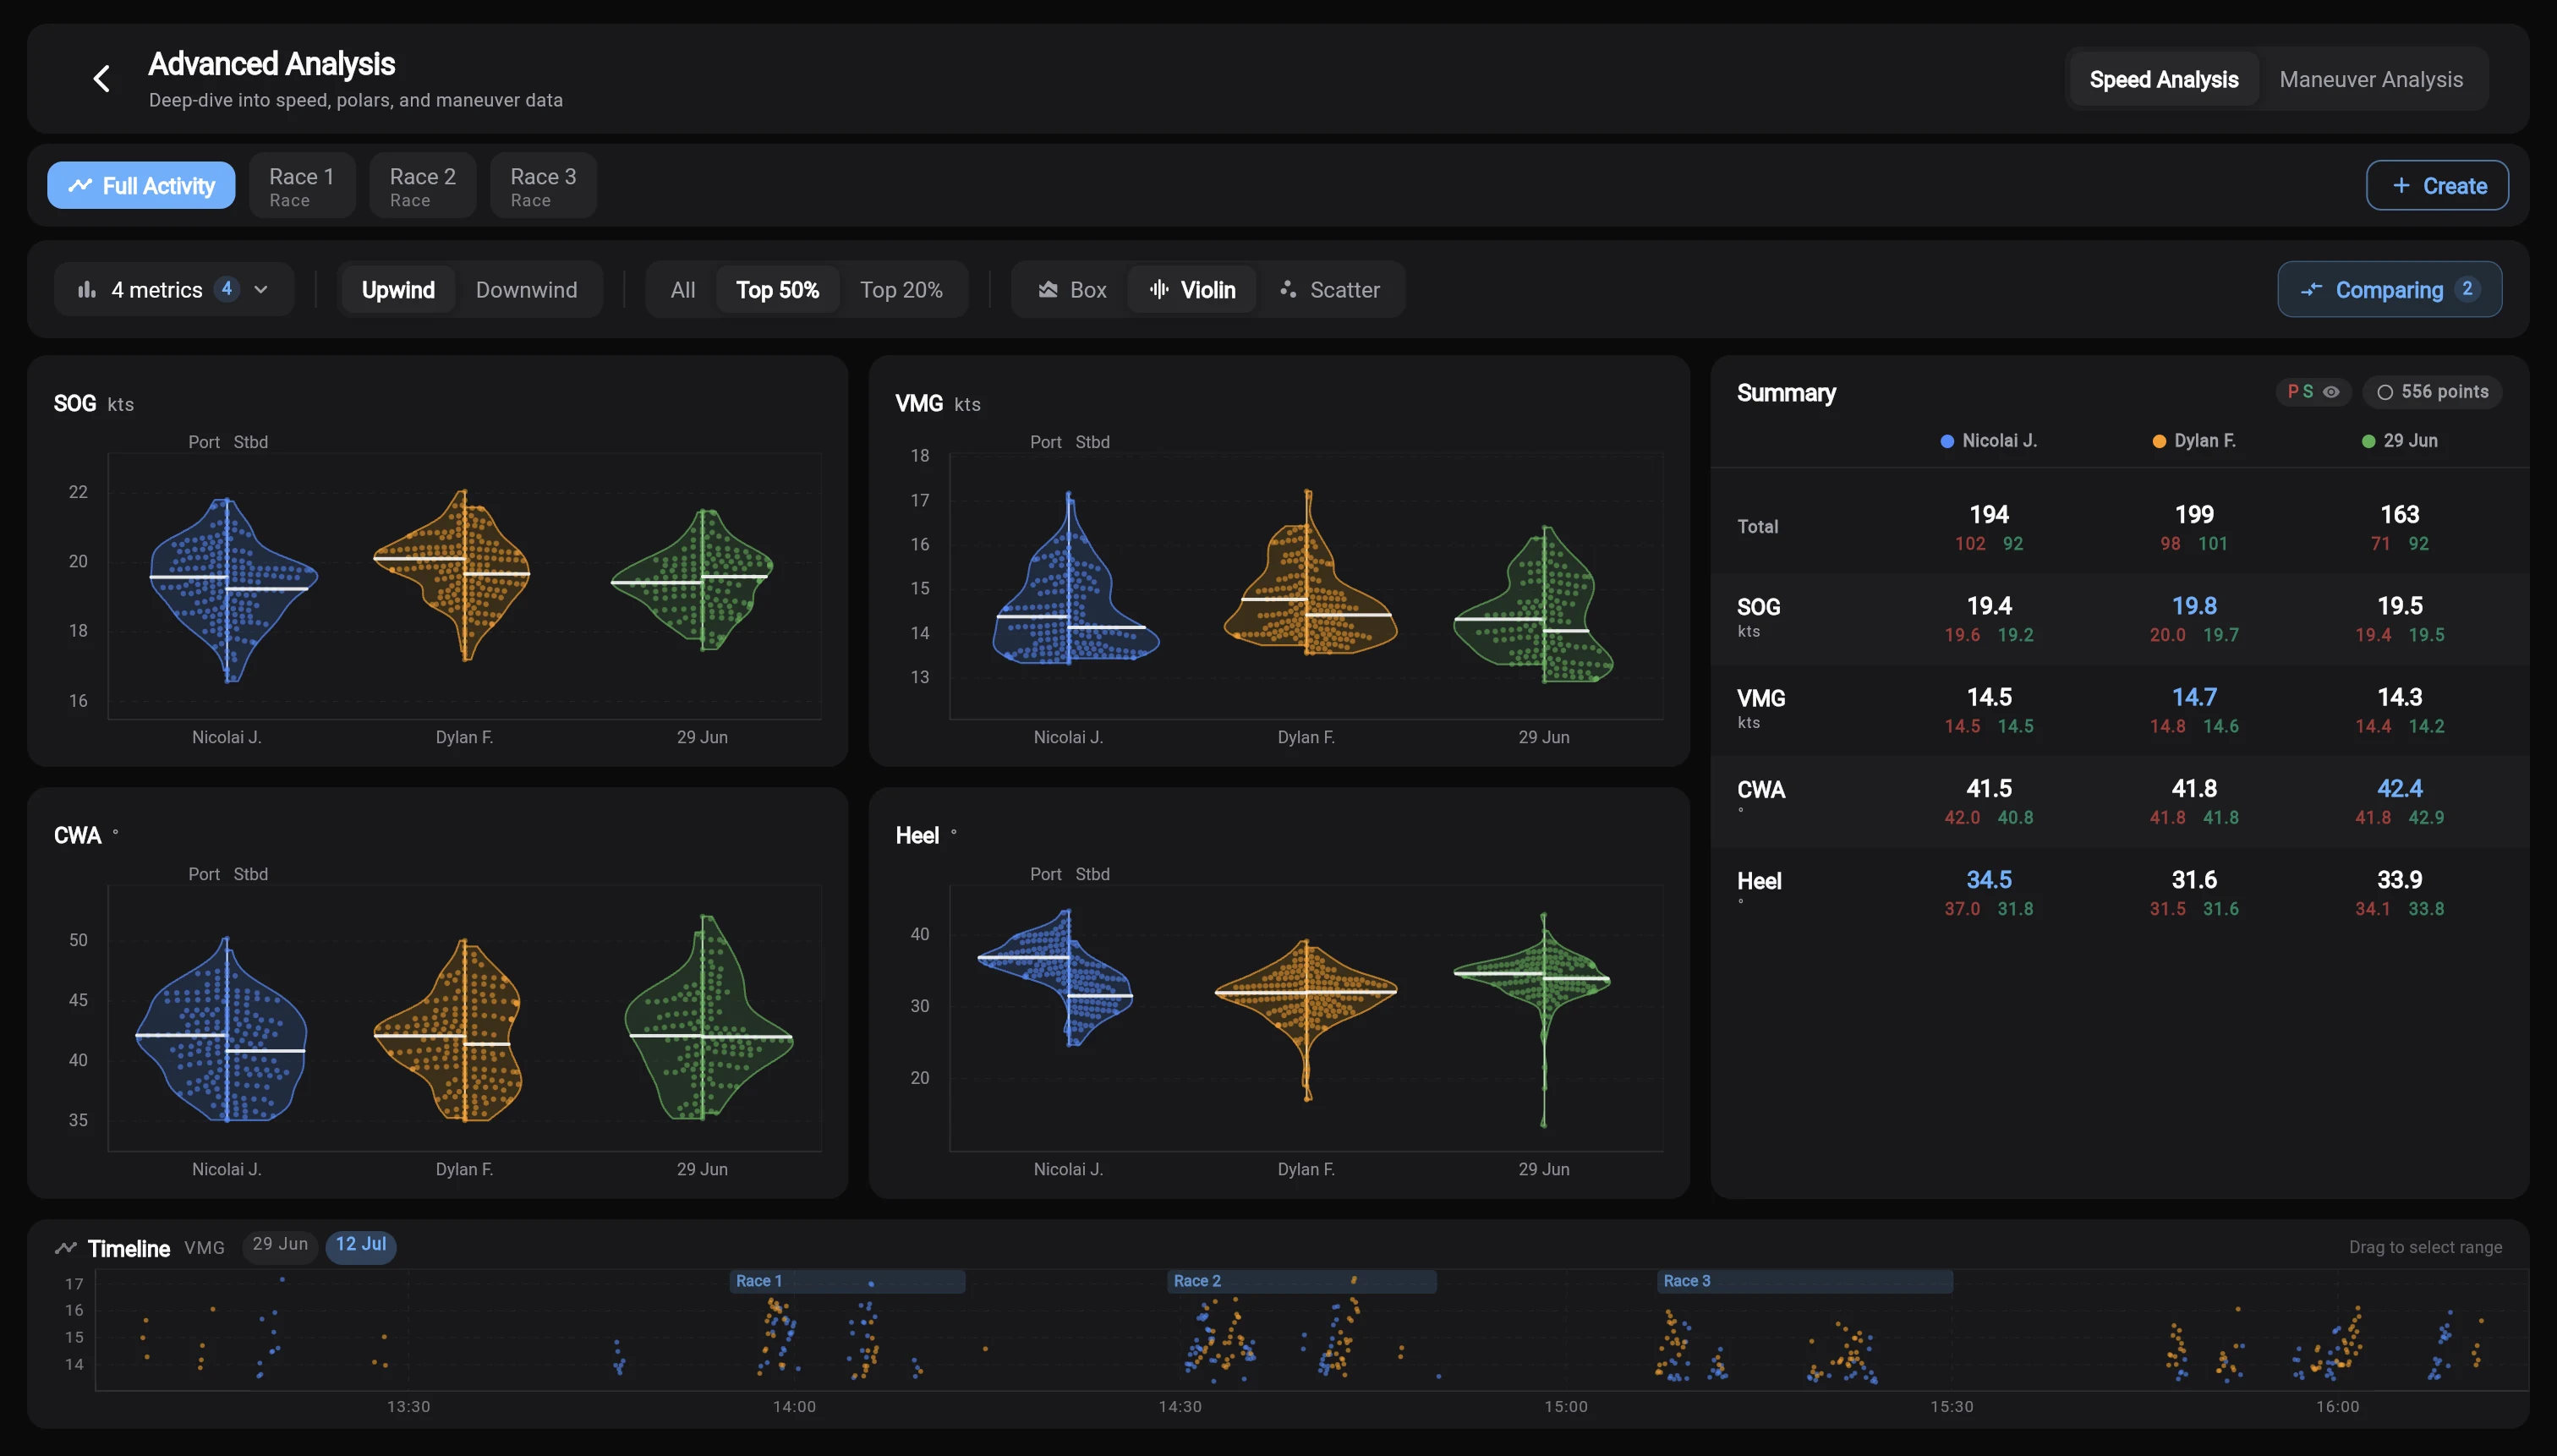
What Top 50% and Top 20% select
These Pro/Coach filters keep the higher-VMG sailing within each activity and tack, after the relevant interval and sailing filters. For example, Top 20% helps you inspect the strongest part of the available sailing.
The selection is based on VMG, not SOG. Each sailor’s selection can come from different moments. Use All when you want to include weaker periods and judge consistency.
Select points in a scatter plot
Select a point or drag a loop around a group. The selection count shows an active selection; clear it before returning to the full set. Use X Axis to change the relationship being examined.
If a chart is empty
Try Full Activity, All and a basic GPS metric. The selected interval may not contain qualifying sailing, or the sensor channel may have no usable samples.