Replay and analysis
Analyze tacks and gybes
Examine the approach, turn and recovery to identify what needs practice.
iOS, Android and web · Core features; additional views and filters require Pro or Coach
Where to start
Activity → Advanced Analysis → Maneuver. On a phone, use Switch analysis if needed.
Choose the turns to compare
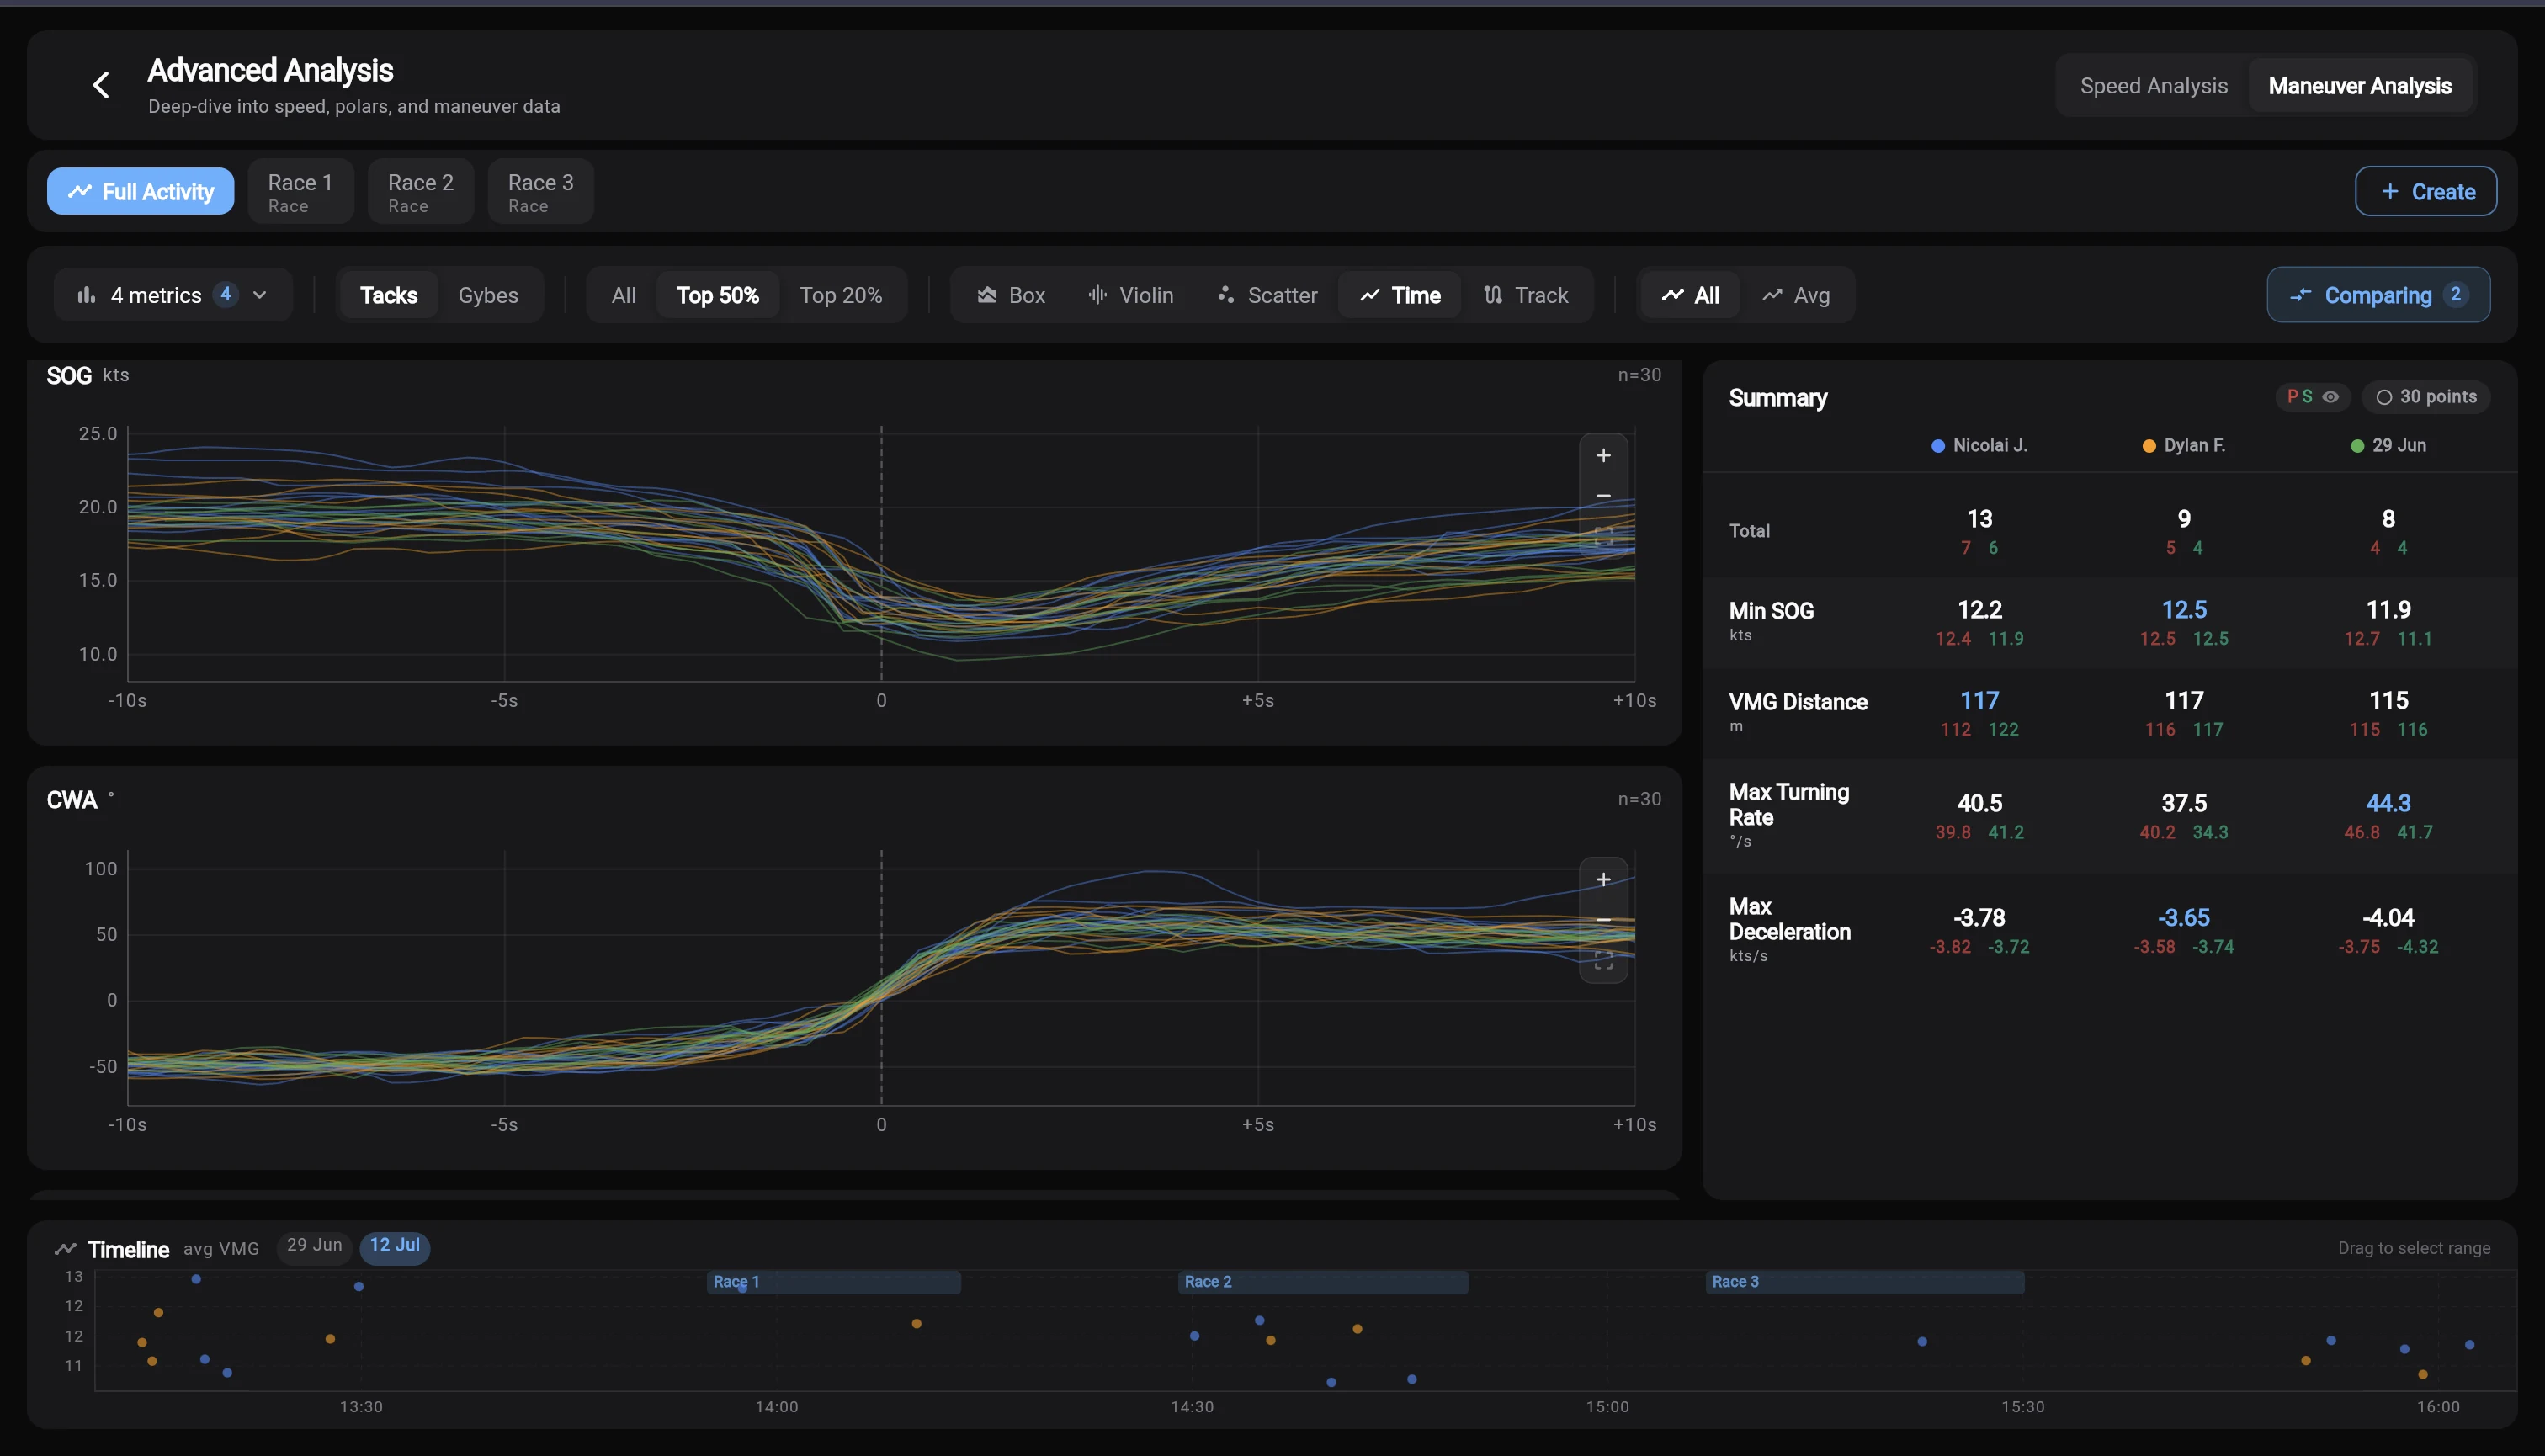
Select Tacks or Gybes, then Full Activity or a saved segment. Check the maneuver count so you know whether the charts describe many turns or just a few.
Compare entry, minimum and exit speed
Use Y Metrics to select Entry SOG, Min SOG and Exit SOG. Read them together: a faster exit can follow a faster entry, even if the boat loses more speed in the turn.
Look at progress and the turn itself
Add Avg VMG or VMG Distance to assess progress through the maneuver. Turning rate, turn angle, heel and acceleration can help explain how that result was achieved. Each is defined in the metrics reference.
Follow the maneuver through time
With Pro or Coach, open Time to see when speed falls and how it recovers. Open Track to compare the shapes of the turns. Switch between individual curves and Avg to compare particular turns with the overall pattern.
Check what happened on the water
Return to replay and aligned video to investigate the movement or timing behind a difference. Add a note at the moment you want to revisit.
Understanding Avg and the Top filters
The chart control labelled Avg shows a median curve. Where a shaded band is shown, it contains the middle half of the selected curves. A narrower band indicates more repeatable behavior at that point.
The metric Avg VMG has a different meaning: it is the average VMG for one maneuver.
Top 50% and Top 20% use VMG ranking to focus on stronger maneuvers. Use All to include the broader set.
If a maneuver is missing
Check the selected interval, recording coverage and wind reference. Sparse samples or incorrect wind classification can limit detection.